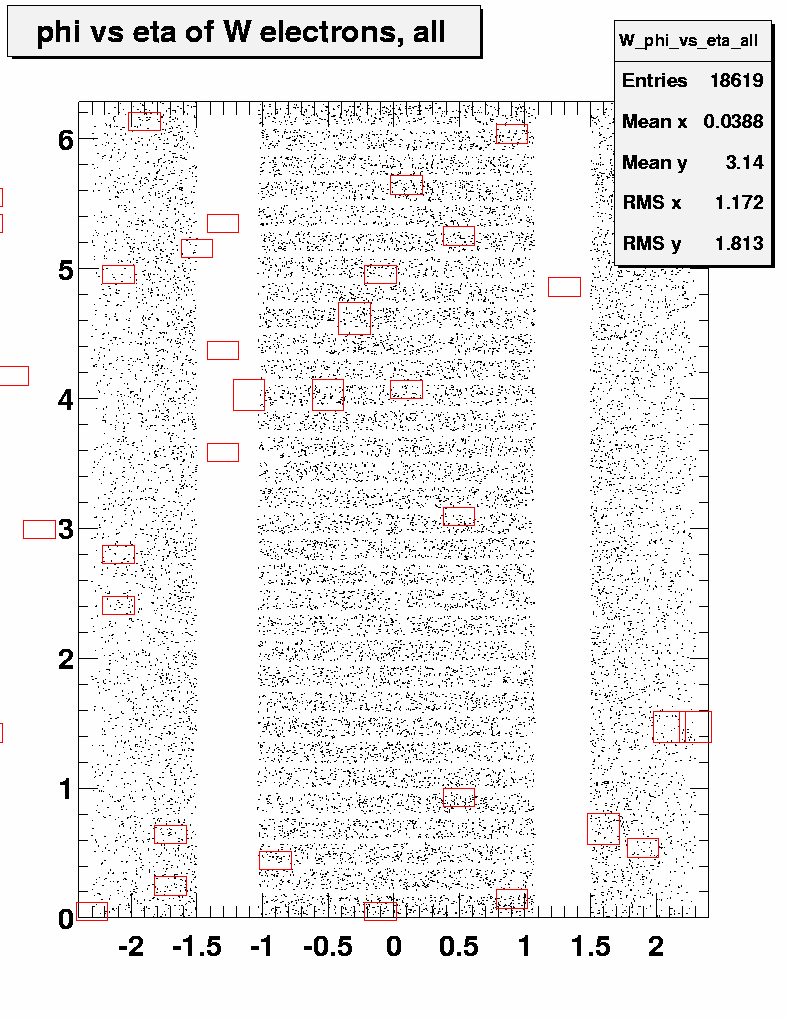
There is a blank plot below with all boxes numbered.
Data (from p13.05 and p13.06)
Check effects of emid cuts on checkerboard
With all cuts
no hm8
no hm8 or isolation
no hm8,isolation or emfrac
run ranges:
1) 162000-171603, 2) 171604-175144, 3) 175145-175689, 4) 175690-180000
histograms for all ranges, no floor weights
histograms for first range with floor weights
range 1
range 2
range 3
range 4

first run range weighted by et/25GeV
first run range weighted by (em1 energy)/(total energy)
first run range weighted by (em2 energy)/(total energy)
first run range weighted by (em3 energy)/(total energy)
first run range weighted by (em4 energy)/(total energy)
![]()
W enu MC
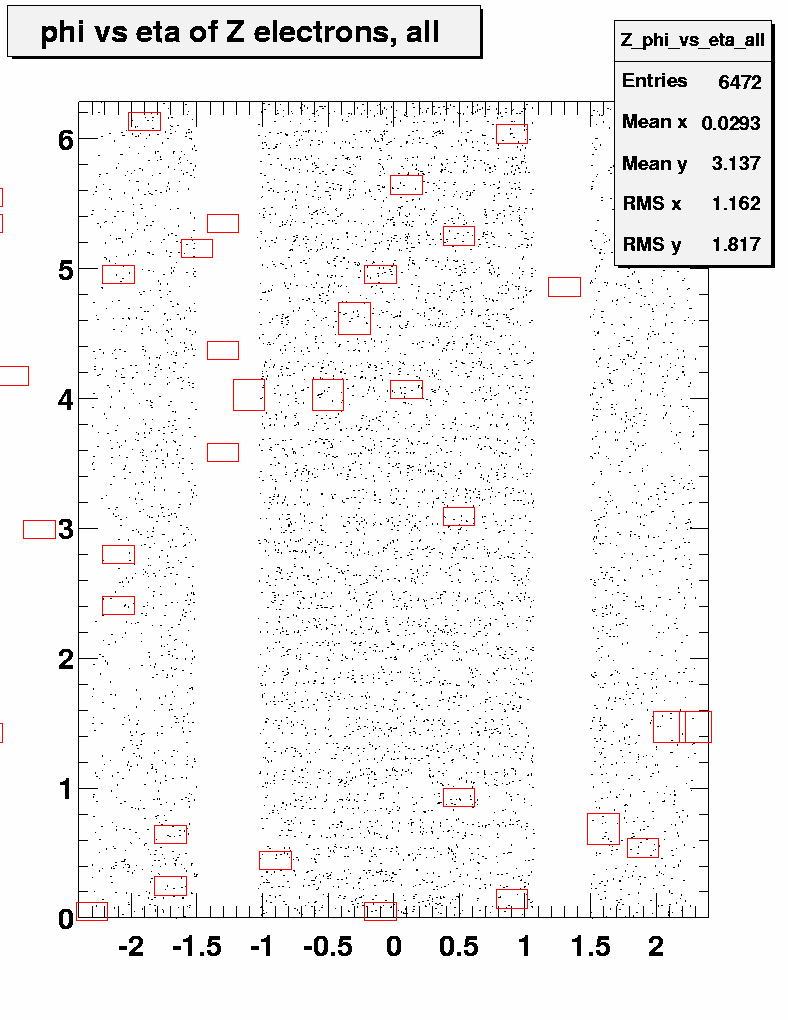
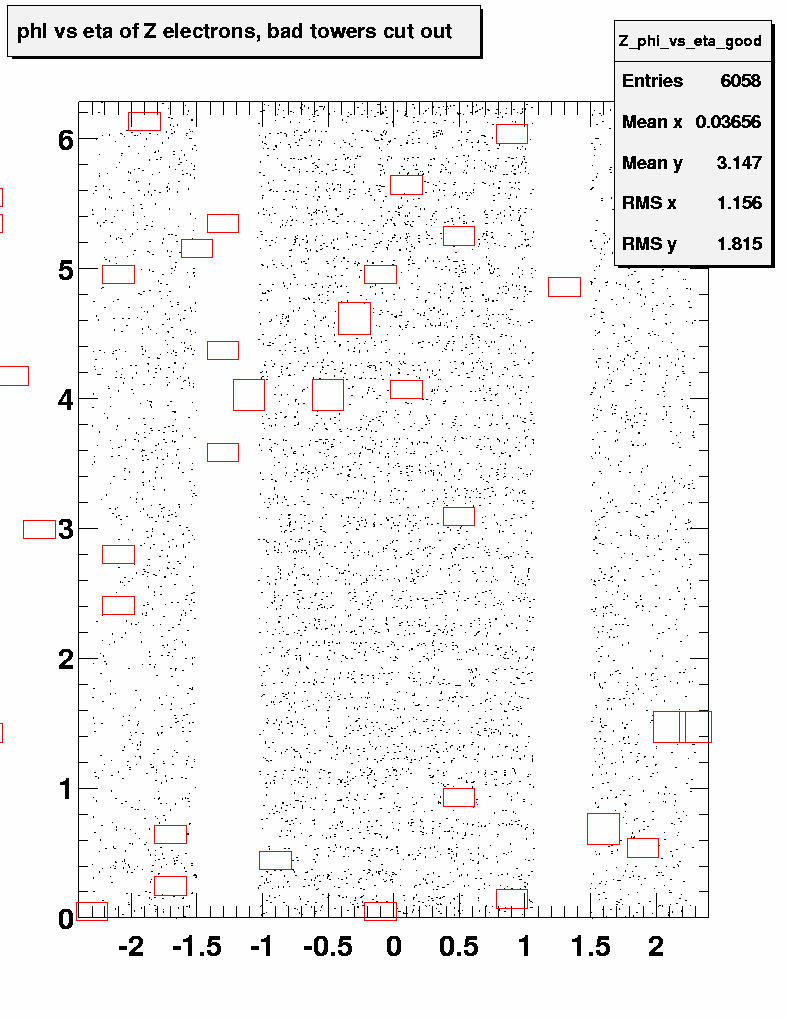
Z ee MC